Connecting the map layer to data
Most reports use the "Map" object to display analytical data, for example sales levels in various countries. So a map layer must be connected to a data source using the map object editor window. Select the layer from the layers tree and switch to the "Data" tab. Data appropriate for the map layer type must be provided:
ESRI shapefile
For map layer of type "ESRI shapefile" the "Data" tab looks like:
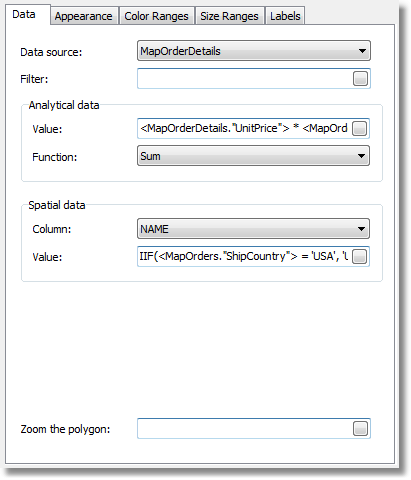
The data required is:
name (eg: the country name);
numeric value (eg: sales volume in this country).
For example, a "Sales" data source may have this data:
Country  SalesTotal
-------  ----------
USA          500000
Germany     1200000
Russia       300000
Set up the "Data" tab in the following way:
data source:
Salesspatial data, column name: select the column containing country names; usually this is the "NAME" column
spatial data, value:
[Sales.Country]analytical data, value:
[Sales.SalesTotal]analytical data, function:
Sum; this function is used if you have several values per country.
The "Zoom the polygon" edit box allows zooming of the polygon with a given name, so it occupies the whole "Map" object workspace. For example, to zoom Germany on the world map, type 'Germany' (with quotes) in this edit box.
Geodata from an application
For map layer of type "Geodata from an application" the "Data" tab looks like:
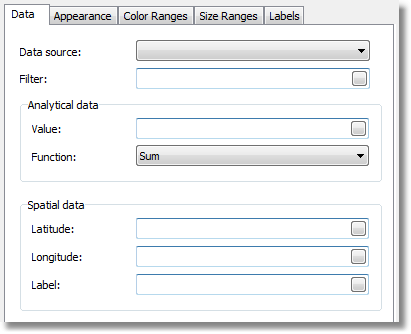
And the data required is:
spatial data : latitude and longitude;
label (eg: a city name);
numeric value (eg: sales volume in this city).
For example, a "Sales" data source may have this data:
Latitude  Longitude  CityName  SalesTotal
--------  ---------  --------  ----------
48.13641  11.57753   München        50000
50.94165  6.95505    Köln           36000
Set up the "Data" tab in the following way:
the data source:
Salesspatial data, latitude:
[Sales.Latitude]spatial data, longitude:
[Sales.Longitude]spatial data, label:
[Sales.CityName]analytical data, value:
[Sales.SalesTotal]analytical data, function:
Sum; this function is used if you have several values per city.