So far our example reports have used only one data band (“First level data” or ”MasterData”) to control data output. This was adequate for the output of data from one DB table. FastReport also allows reports to be designed having up to six data levels, all on the one design page. Furthermore, an unlimited number of data levels in reports can be achieved by the use of the “Subreport” object - this object is covered later on. Most reports in general need only one, two or three data levels, larger numbers of data levels are rare.
Let's look at how to design a two data level report. The report will output data from the demo tables: “Customer” and “Orders”. The first table is a list of customers and the second one is a list of orders placed by those customers. The tables contain data in the following fields:
Customer:
CustNo Company
1221 Kauai Dive Shoppe
1231 Unisco
1351 Sight Diver
….
Orders:
OrderNo CustNo SaleDate
1003 1351 12.04.1988
1023 1221 01.07.1988
1052 1351 06.01.1989
1055 1351 04.02.1989
1060 1231 28.02.1989
1123 1221 24.08.1993
….
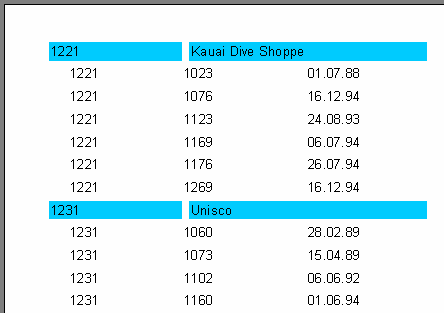
As you can see, the second table contains the list of all the orders placed by all the customers. To view the orders from the Orders table which are placed by one customer in the Customers table, the two tables are linked on the “CustNo” field, which is common to both tables. The report output from this data should appear as follows:
1221 Kauai Dive Shoppe
1023 01.07.1988
1123 24.08.1993
1231 Unisco
1060 28.02.1989
1351 Sight Diver
1003 12.04.1988
1052 06.01.1989
1055 04.02.1989
Let's design the report. Create a new project in Delphi, place two “TTable”, one "TDataSource", two “TfrxDBDataSet” and one “TfrxReport” components on the form. Set the component properties as shown here:
Table1:
DatabaseName = 'DBDEMOS'
TableName = 'Customer.db'
Table2:
DatabaseName = 'DBDEMOS'
TableName = 'Orders.db'
DataSource1:
DataSet = Table1
frxDBDataSet1:
DataSet = Table1
UserName = 'Customers'
frxDBDataSet2:
DataSet = Table2
UserName = 'Orders'
In the report designer, enable the data sources in the “Report>Data...” dialogue. Now add a “MasterData” and a “DetailData” band to the page:
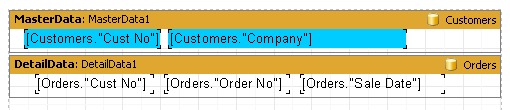
Note that the “MasterData” band must be placed above the “DetailData” band! Drag it there if necessary. If the Master is placed under the Detail, FastReport will generate an error message when you preview the report.
If you previewed the report now, you would see that the list of orders remains the same for every customer and contains all the records from the “Orders” table. This would be because we have not set the MasterSource property of the “Orders” table. Set “MasterSource = DataSource1” for the “Table2” component on the Delphi form. Now we have set a 'master-detail' relationship. After that, we select the fields to link on. Set the “MasterFields” property of the “Table2” component:
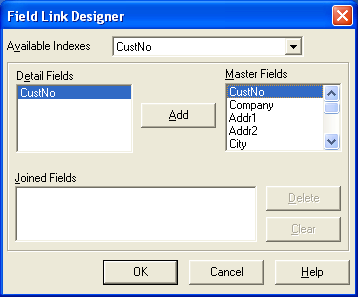
We need to link together the “CustNo” fields in the two sources. To do this, select the desired fields and click the “Add” button. The Field link will appear in the bottom pane. Finish by closing the editor using ОК.
When creating the preview FastReport does the following. After a record is output from the master table (Customer), it sets the filter on the detail table (Orders). Only those records which meet the 'Orders.CustNo = Customer.CustNo' condition will remain in the table. This means that for each customer only those orders which belong to the current customer will be displayed in the detail band. This is an important concept to grasp. Even though data bands may be of master or of detail type, they only control the positioning of the data on the output page (order and number of times displayed). The data displayed by the objects in the bands is dependent on which fields the objects are linked to and on the external linking of the two tables.
This is the final output:
Reports containing up to 6 data levels can be constructed in a similar manner.