In the previous example we constructed a two-level report based on the data from two tables. Another report which looks the same can be constructed in FastReport, this time based on a dataset obtained from a joined query.
To do this, an SQL query is needed which returns data from both tables and sorted in a particular way. In our example, the tables will be joined on the “CustNo” fields present in both tables. The query might be:
select * from customer, orders
where orders.CustNo = customer.CustNo
order by customer.CustNo
The "order by" line is required to sort the records on the “CustNo” field. This query returns a dataset like:
CustNo Company … OrderNo SaleDate
1221 Kauai Dive Shoppe 1023 01.07.1988
1221 Kauai Dive Shoppe 1123 24.08.1993
1231 Unisco 1060 28.02.1989
1351 Sight Diver 1003 12.04.1988
1351 Sight Diver 1052 06.01.1989
1351 Sight Diver 1055 04.02.1989
How can a multi-level report be designed using this data? In FastReport there is a special band, the “Group Header”. A condition (a DB field value or an expression) is specifed for the band; the band is output every time the condition's value changes. The following example illustrates this.
Let's create a new project in Delphi and place “TQuery”, “TfrxReport” and “TfrxDBDataSet” components on the form. Set their properties as shown here:
Query1:
DatabaseName = 'DBDEMOS'
SQL =
select * from customer, orders
where orders.CustNo = customer.CustNo
order by customer.CustNo
frxDBDataSet1:
DataSet = Query1
UserName = 'Group'
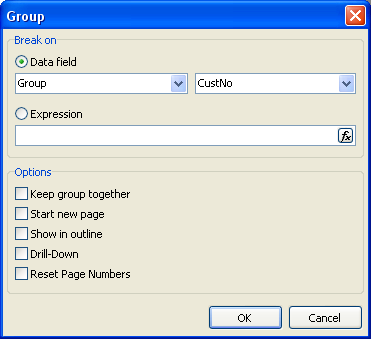
Open the report designer and create a new report. Connect our data source to the report. After that, add a “Group header” band to the report. Set a condition (in this case the “Group.CustNo” data field) in the “Group header” band editor:
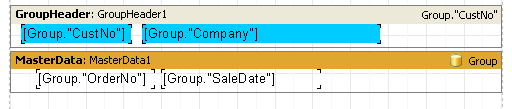
Also link the data band to the “Group” data source and arrange some objects as shown (note that the group header must be placed above the data band):
On previewing the report, we obtain output similar to this:
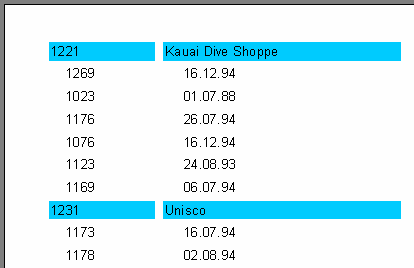
As you can see, the “Group header” band is output only when the field to which it is linked changes in value. Otherwise the data band connected to the “Group” dataset is displayed. If we compare this report to the master-detail report constructed earlier, it is obvious that order numbers are not sorted at all. This can be easily corrected by changing the SQL query’s 'order by' clause:
select * from customer, orders
where orders.CustNo = customer.CustNo
order by customer.CustNo, orders.OrderNo
Reports having nested groups can be designed in a similar way. The depth of nesting of groups is unlimited. Reports which use groups have some advantages over reports of the master-detail type:
- the whole report needs only one dataset (query)
- the number of data grouping levels is unlimited
- data sorting becomes possible
- more optimal usage of the DB resources (the query returns only one dataset for output, with filtering done by the query).
The only disadvantage is the need to write queries in the SQL language. However, a basic knowledge of SQL is virtually obligatory for any programmer working with databases.