The quality of the export output in any format is highly dependent on the quality of the original report design. FastReport can manipulate objects in a large number of ways during report creation. This has the advantage of fast development of reports and subsequent printing. Printed documents look just as previewed. This is the primary objective of the FastReport report engine. The downside of this development freedom is the complexity of exporting FastReport documents to different data formats, each of which has its own, sometimes complex, requirements and limitations. In this chapter, special design requirements for reports intended for export will be discussed.
Many formats use tabular data presentation, such as HTML, XLS, XML, RTF and CSV. In contrast to the freedom allowed in FastReport page design, when exporting to these formats the output cells created for these tables cannot intersect or be arranged in layers. Export filters, as a rule, take into account these requirements when objects are exported by FastReport, by the use of special algorithms dealing with intersections and the optimal placing of cells. At object intersections new columns and lines are created in the output table. This is necessary to enable FastReport to position objects exactly and to obtain the best correspondence with the original preview page. A large number of intersecting objects in a report design leads to a large number of additional columns and rows in the output table. This in turn can lead to the need for editing of the exported file in its own editor before suitable for further use.
For example, take a report where the design has a slight overlap of two objects in the same band and the number of records in the report is 150. On export to RTF format 450 lines will be created (150 rows for each object and 150 rows for the intersection). If we remove the overlap there would only be 300 rows. For large reports with a large number of objects the difference would be much greater. This, of course, affects the size of the output file.
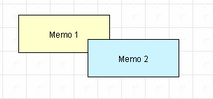
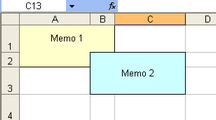
Objects in the report Export to Excel - result
Bear this in mind when designing reports intended for export to any of the formats that use the 'table' output method.
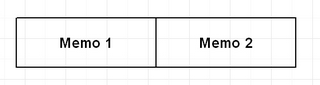
When designing tables in reports be aware of the borders of neighboring cells. It is important that cells do not overlap and are not arranged in layers. The export algorithm may deal with the cells in an unexpected way and give a result far from that intended. It is best to arrange objects in such a way that they are placed in line both vertically and horizontally. Guidelines can help to achieve this.
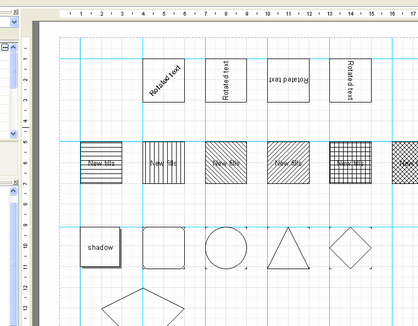
Using guidelines in the designer
To use guidelines in FastReport designer just click on the horizontal or vertical ruler at the top or left edge of the report page and drag the ruler to the required position on the page, where a guideline will be displayed. You will then be able to place objects aligning to these horizontal and vertical guidelines.
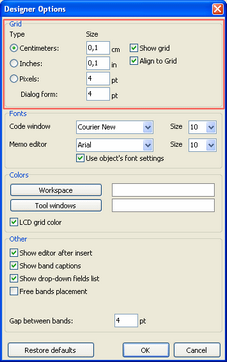
Grid alignment can also be helpful in placing “Text” objects to avoid them overlapping. The grid is enabled in the designer Options, where the pitch can also be adjusted : “View > Options > Grid”.
When using frames around “Text” objects it is best to use the object's frame properties, rather than adding graphic objects like lines and rectangles around the text. Also, try not to use objects in the background beneath transparent text objects.
Keeping these simple rules in mind will help you to create a report which will look perfect after export to any format that uses the table-based output method.
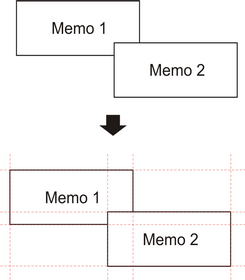
Below are some examples of good and bad arrangement of objects.
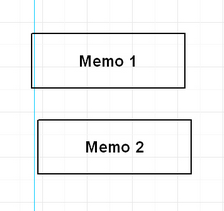
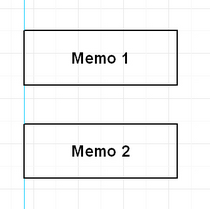
Bad Good
The objects are displaced horizontally - they do not line up horizontally with the vertical guideline.
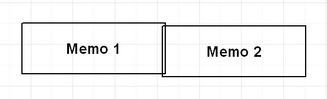
Bad
Good
The objects are overlapping - on export to a table/diagram format additional unnecessary rows and columns and also three additional cells in the overlap zone are created.
Study of the demo reports included in the FastReport installation is recommended, to help master the basic principles of good report design.