There are two icons for wizards helping to create new reports and two icons for the straight forward creation of new reports:
- Standard report wizard
- Dot-matrix report wizard
- Standard report
- Dot-matrix report
Icons of type "Standard report" and "Dot-matrix report" create the empty standard and dot-matrix reports respectively (there is more about dot-matrix reports in previous sections). These new reports contain one empty page.
Icons of type "Standard report wizard" and "Dot-matrix report wizard" guide the process of choosing the dataset and fields required for the report, the optional creation of groups and the selection of data layout. Let's look at a report created with the help of the "Standard report wizard".
Choose "File > New..." and the "Standard report wizard" icon. The report wizard dialogue appears:
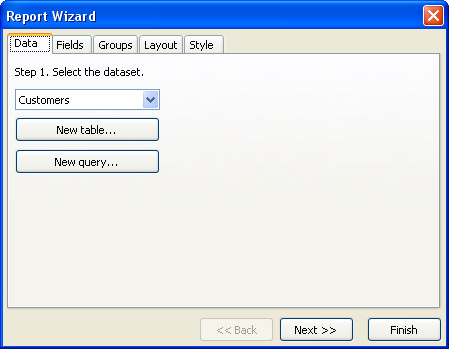
The dialogue has several tabs. On the first tab choose the data source for the report. All data sources available in your application are listed here (TfrxDBDataSet components). New data sources can be created, either tables or queries, using the "New table" or "New query" buttons. These buttons open the "New table/query" wizard (described later in this chapter). Let's choose the Customers table. Then press the "Next >>" button.
On the next tab select the fields to be displayed in the report:
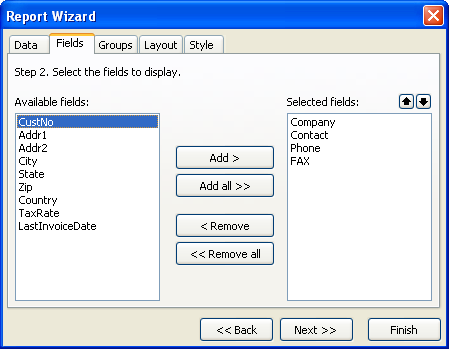
On the left side is a list of available fields; on the right side a list of fields already selected to appear in the report. Use the "Add >", "Add all >>", "< Remove" and "<< Remove all" buttons to move fields from one list to another. Use the ![]() buttons to move selected fields up or down in the list. Let's add the "Company", "Contact", "Phone" and "FAX" fields to the selected fields list and press the "Next >>" button.
buttons to move selected fields up or down in the list. Let's add the "Company", "Contact", "Phone" and "FAX" fields to the selected fields list and press the "Next >>" button.
On the next tab one or more groups can be created. FastReport will add the Group header and Group footer bands to the report.
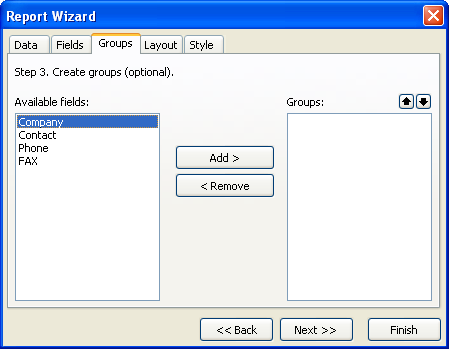
Group creation is optional. Skip it here by pressing the "Next >>" button.
The next tab sets the page orientation and one of two data layouts - tabular and columnar:
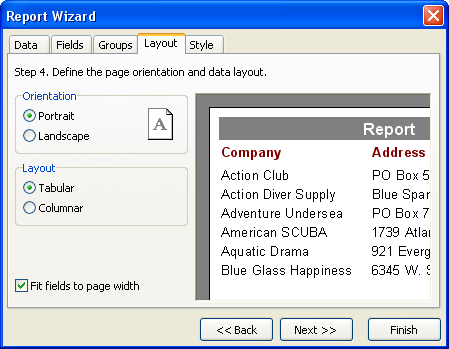
The chosen layout is illustrated on the right side of the dialogue.
Finally, the last tab lists the available color schemes for your report, again illustrated on the right side of the dialogue..
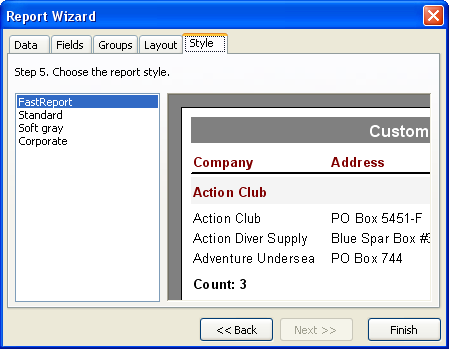
When the "Finish" button is pressed the wizard will create the following report:
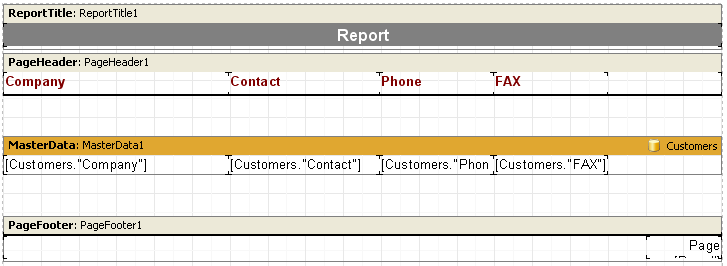
The report can now be previewed.