External objects (such as lines, shapes, pictures) can be placed in the cross-tab. You may need to show, for example, some data in a graphical form. Let's look at an example that uses shapes to display a rudimentary progress bar:
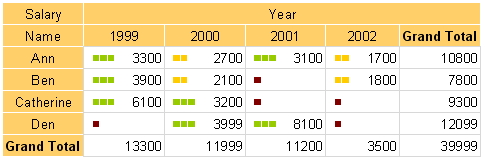
A dark red bar is displayed if the cell value is less than 100, yellow if less than 3000 or green if more that 3000.
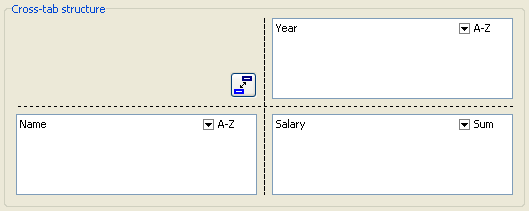
Let's start with our report. Place a "DB Cross-tab" object on the report page and set its properties like this:
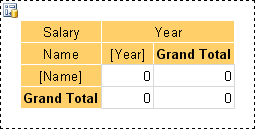
Turn off the “Auto-Size” property and set the column widths as shown below:
Now add the shape object to our table by selecting the “Rectangle” object on the object toolbar and placing it inside the cell:
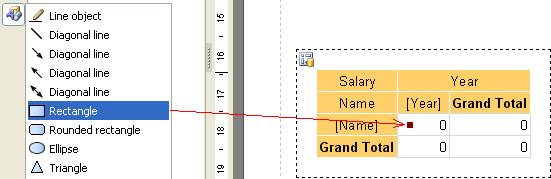
Change its height and width to 0.2cm and set its top and left properties. Add two more similar rectangles.
Now create a script that will show the correct number of colored shapes (depending on the cell value). To do this select the cell and create an “OnBeforePrint” event handler:
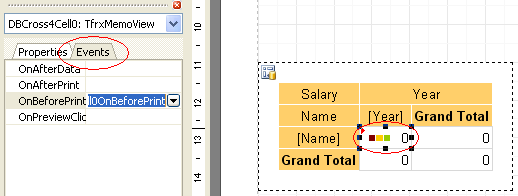
Write the following code in the event handler (pay attention to the shape names, so that they match your objects):
procedure DBCross1Cell0OnBeforePrint(Sender: TfrxComponent);
begin
// 'Value' is the current cell's value
if Value < 100 then
begin
// first shape object
DBCross1Object1.Color := clMaroon; // dark red
// second shape object
DBCross1Object2.Color := clWhite;
// third shape object
DBCross1Object3.Color := clWhite;
end
else if Value < 3000 then
begin
DBCross1Object1.Color := $00CCFF; // yellow
DBCross1Object2.Color := $00CCFF;
DBCross1Object3.Color := clWhite;
end
else
begin
DBCross1Object1.Color := $00CC98; // green
DBCross1Object2.Color := $00CC98;
DBCross1Object3.Color := $00CC98;
end;
end;
That's all - preview the report, which will be similar to that shown at the top of this section.