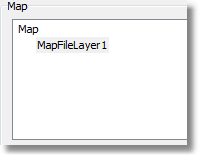
The "Map" object can contain one or more layers. The layer structure is displayed in the upper left part of the editor window:
To add a new layer, click on the "Add..." button, which opens the following dialog:
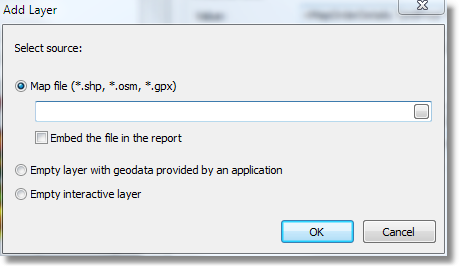
At this point, choose the type of the layer, from:
- the map from an ESRI shapefile. This is the most commonly used type for maps. For example, you can display the world map and highlight some countries in color, depending on the sales level for these countries;
- the geodata from your application. Your application must provide the following data: latitude, longitude, name and value. This data is displayed as a small point on the layer. The point can have a caption and can also have a variable size/color, dependent on the value provided. In practice, this type of layer is used together with a base layer of "ESRI shapefile" type. The base layer (the first one) is configured to display a country map (for example) and the second layer (geodata from an application) displays points - city names where sales occurred. The color and size of a point can be configured to reflect sales level.
If the "ESRI shapefile" layer type is chosen, select how the map data is stored, from:
- the whole map data is embedded in the report file. In this case the report file (.frx) may be large;
- the report file holds a reference to the map files (.shp/.dbf). This mode is useful if several reports use the same map files.
Note: Large map files (more than 30Mb) or map files containing a lot of polygons (more than 20,000) slow down report generation.