Data highlight
FastCube.Net cross-table allows to set a special display style for the particular measure values.
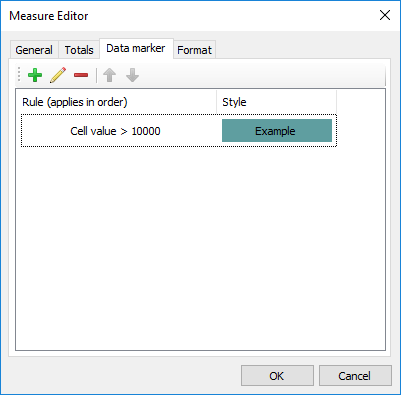
It is necessary to create a highlight rule (or several rules) in the measure properties dialog to highlight measure data.
All highlight rules can be divided into 2 types which will be given below:
- highlight all measure cells depending on their values,
- highlight only those cells which match the specified condition.
Rules apply to cells consistently. Therefore, if one cell matches 2 rules which both change cell background then the last rule wins. On the other hand, if one rule only changes the background and another changes the font style then cell will get background from the first rule and the font style from the second.
Rules apply to generic cells by default but if needed can also be applied to totals and the grand total. This can be set in the highlight rule setup dialog.
Some rules require to perform additional calculations in the pivot table (like minimum, average, rank, etc). And we know that measures can be placed both in rows and in columns. To perform these calculations FastCube needs to know the Scan direction (the direction to traverse measure cells). "Auto" mode correctly works in the majority of cases but it may be needed to define the direction by hands. In this case the Scan direction option needs to be set to the Rows or Columns mode.