Treemap chart
Description
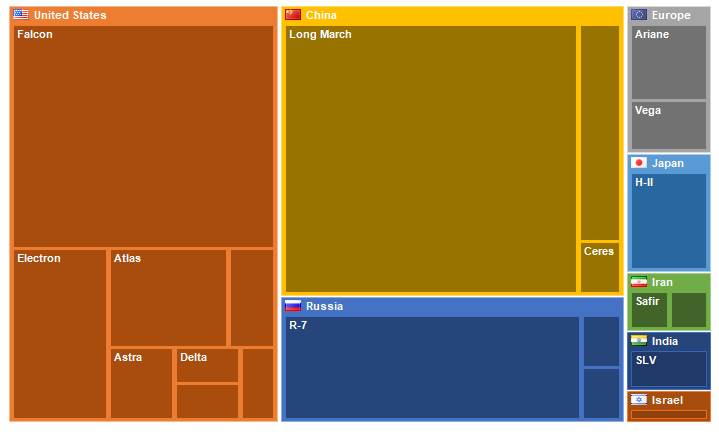
A TreeMap chart is a mode of visualizing hierarchical data in the form of rectangles with areas proportional to the values of the displayed records. Inside the rectangles of parent records, rectangles of child records are nested.
Applications
A tree chart is suitable for simultaneous comparison of several hierarchies.
Display mode
The TreeMap chart display mode can be changed. There are two standard display modes:
BestAspectRatio(default) - in this mode, the area builder will make the rectangles aspect ratio as close to1as possible.UseMinAspect- in this mode, the area builder considers the available width and height and chooses the minimal length (width or height) for each rectangle.
To change the display mode, use the LayoutMode property:
// The TreeMap chart display mode with the best aspect ratio
treeMap.LayoutMode = TreeMapLayoutMode.BestAspectRatio;
// The display mode in which the hierarchical records will use the smallest aspect ratio
treeMap.LayoutMode = TreeMapLayoutMode.UseMinAspect;
In addition, if necessary, you can create your own area builder class and connect it to the component by overriding the GetLayoutBuilder event.