Icicle chart
Description
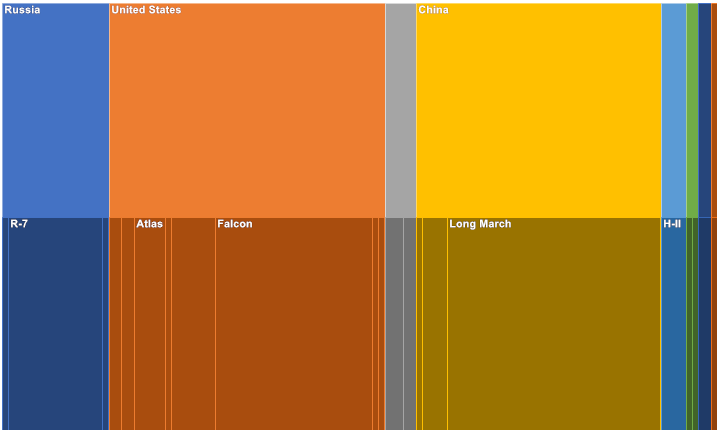
The Icicle chart represents data based on the hierarchical clustering method. The Icicle chart is easier to read, showing which hierarchy the objects belong to and which objects are child ones. The large rectangle at the top of the chart represents the root node, whose width depends on the sum of the child nodes. The child nodes are placed below the parent nodes. The chart can also have several drawing directions: downwards, upwards, leftwards, and rightwards.
Applications
An icicle chart is a good way to visualize hierarchical data. Its advantage is an easily seen hierarchy, its size, and the level at which it is located. It is also great for examining data relationships.
Change of direction
In the Icicle chart, you can change the direction of the chart itself (originally set to Down).
To do this, use the Direction property:
Icicle icicle = new Icicle();
icicle.Direction = IcicleDirection.Right;