New objects
Added the “MSChart” object
The “MSChart” object allows to display charts using Microsoft Chart library. At the moment, “MSChart” can only be used to display charts when viewing reports. Below are some features of the library:
- more than 30 types of charts (bars, areas, lines, bubbles, circular, radar, financial, pyramidal, ranges);
- 3D support;
- supports several series of different types in one chart;
- full control over appearance and behavior of each chart element.
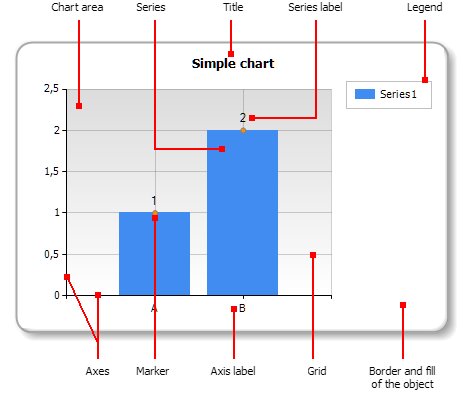
Chart elements
One chart may have one or several chart areas. One chart area may contain one or several series. Below you can see the chart which contains two chart areas (the first area contains two series and the second area contains one series):
Some series (for example, pie series) require exclusive chart area.
Chart editor
The "Chart" object contains numerous settings which can be handled in the chart editor. To invoke the editor, double click the "Chart" object:
Added the “RichText” object [beta]
This object allows to display a formatted text in the RTF format.
Try to use the “Text” object to display a text. When you export the report to other document formats, the “Rich Text” object will be exported as a picture.
You can also use the Microsoft Word to create a text. When you have created the text, save it in the RTF format. Next, open the “Rich Text” editor and load the RTF file into it by pressing the “Open” button.
Please note that the “Rich Text” object does not support all of the Microsoft Word formatting features. We will keep working on this object and adding new features.
New features
Configurable icons in FastReport Online Designer
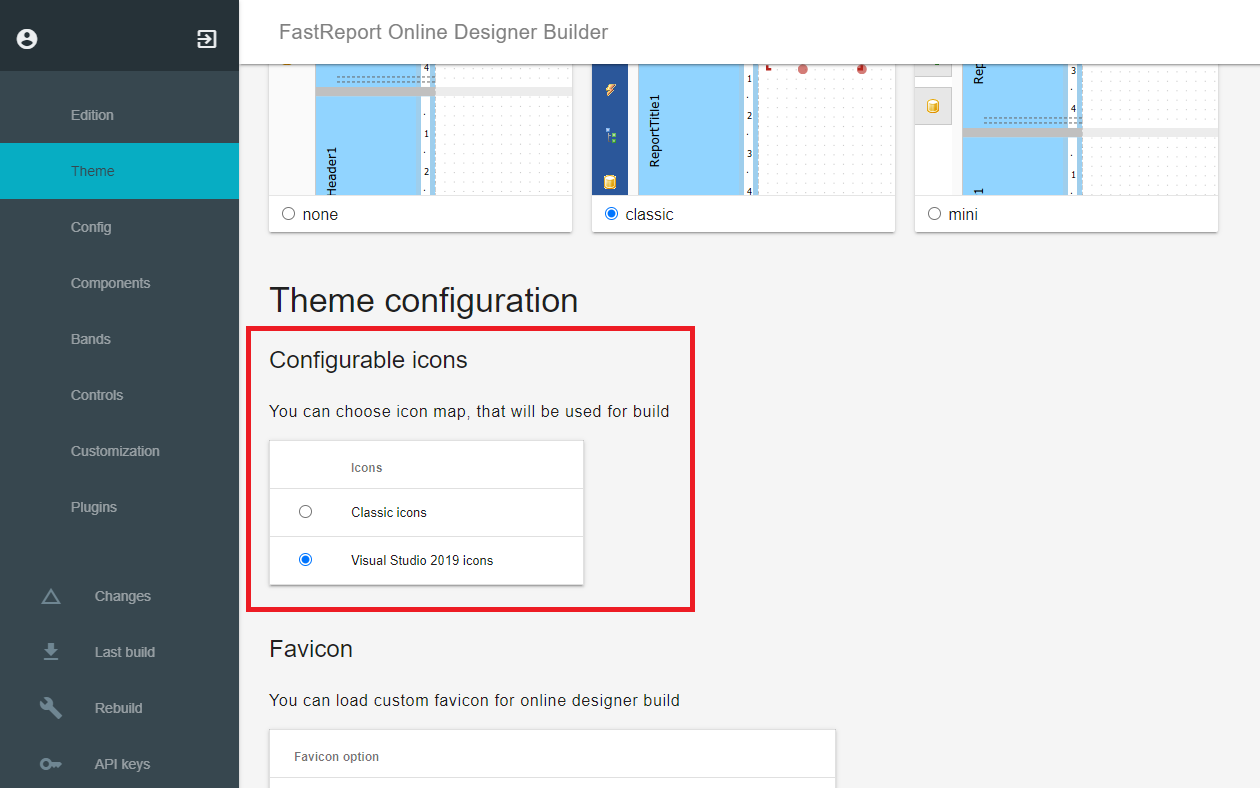
You can now build FastReport Online Designer with different icons. At the moment, you can choose between classic icons and Visual Studio 2019 icons.
Classic icons:
Visual Studio 2019 icons:
To change the icons, go to “Theme” when building the designer and select the set of icons you want to use.
Configuring the API for building FastReport Online Designer
FastReport Online Designer Builder now can build the designer using the API. This allows you to automate the process of building the designer.
API Key
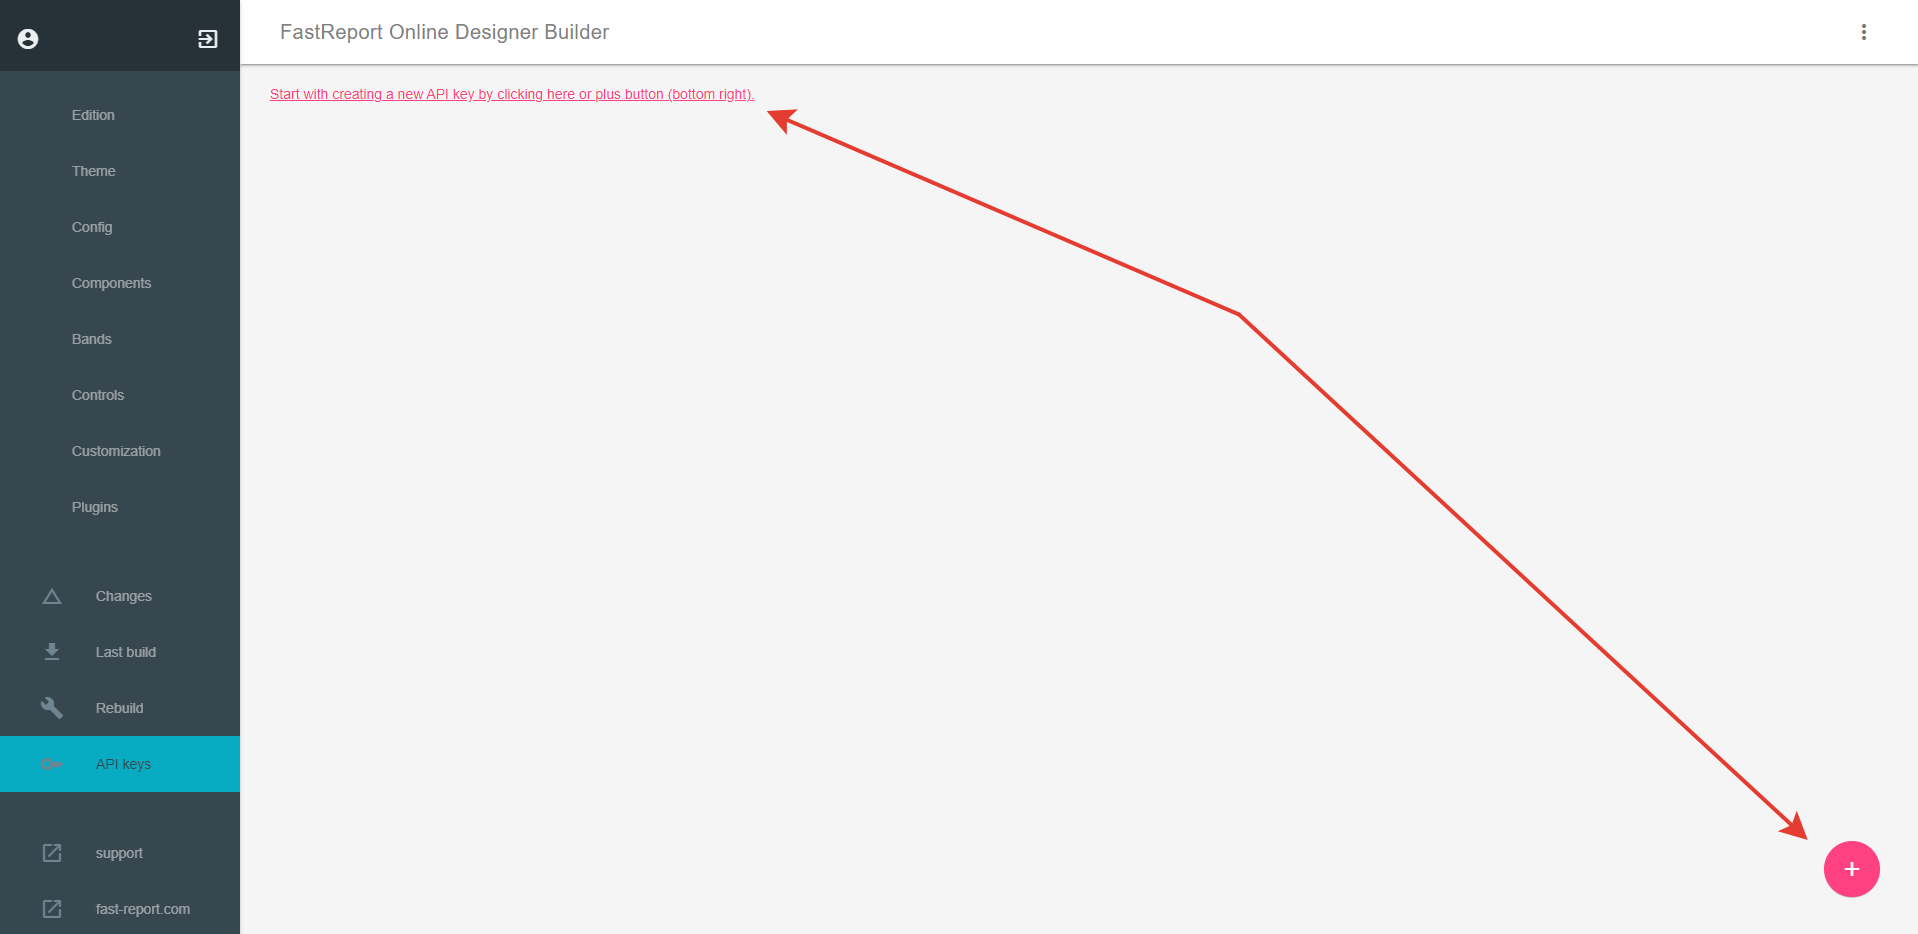
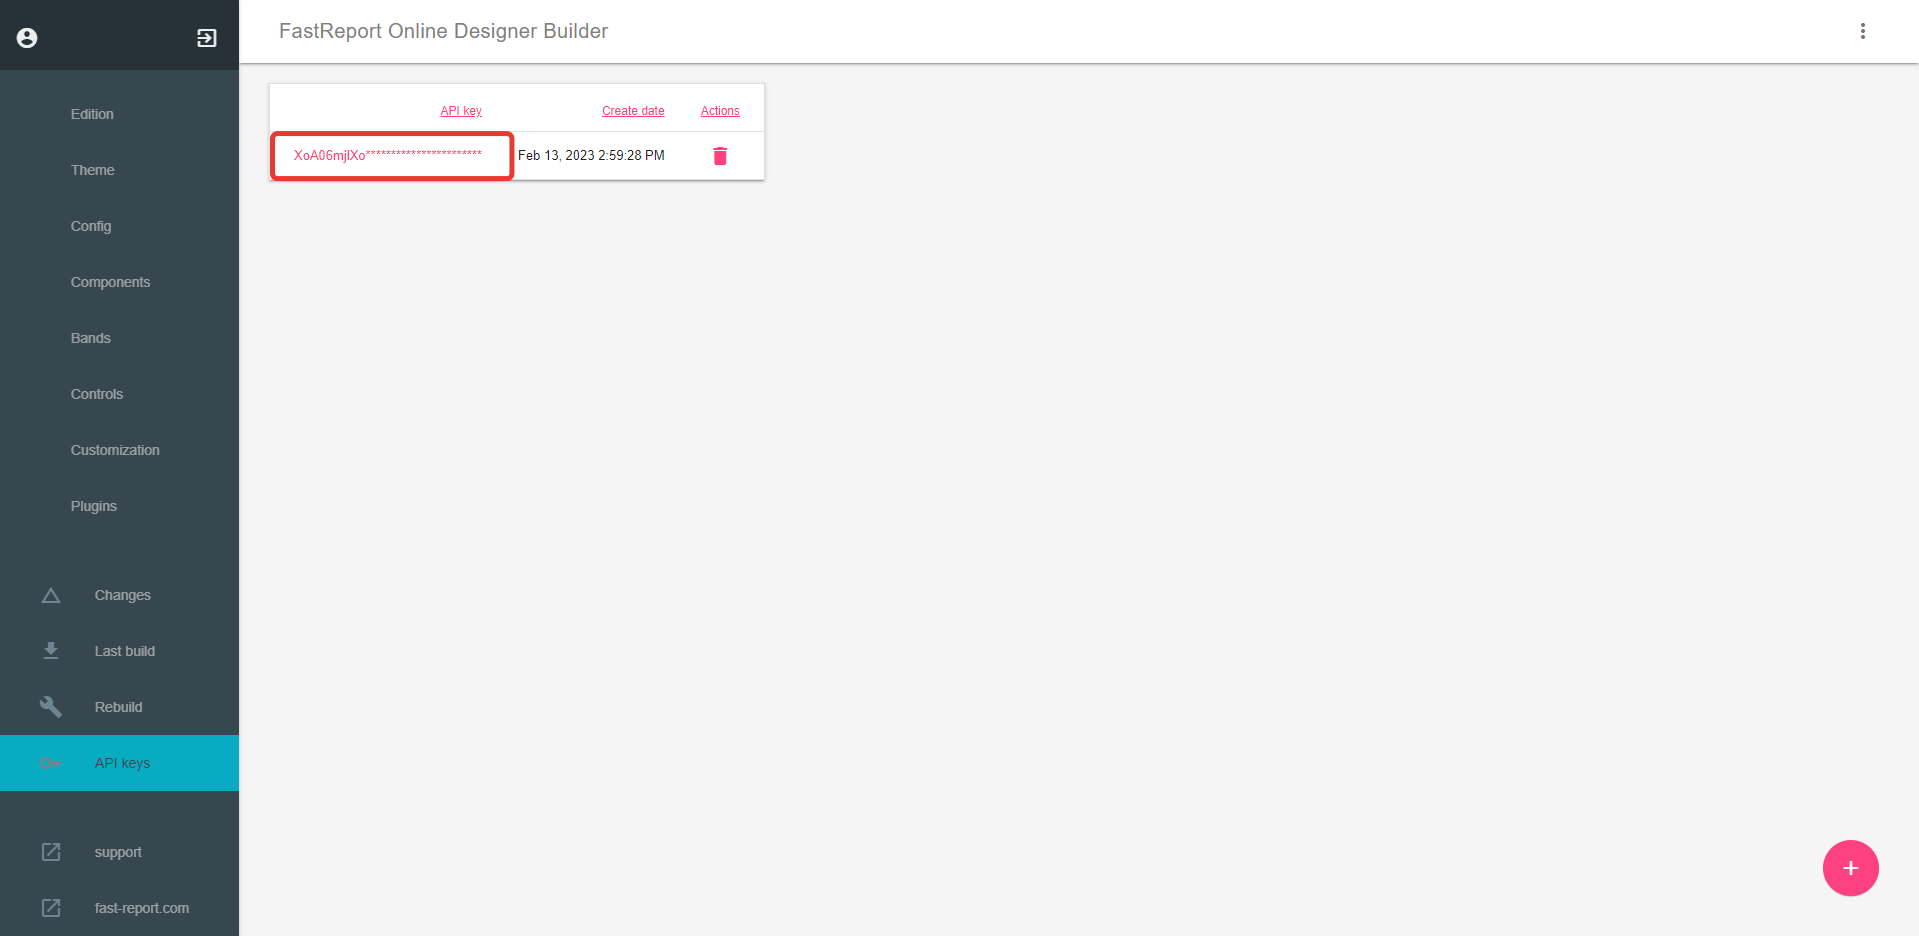
A user is authenticated using an API key, which you can create in FastReport Online Designer Builder. To create a key, you need to:
- sign in with your account;
- go to the new “API Keys” menu item;
- click on the button in the lower right corner or the red inscription.
After that, you will have a new API key generated. You can click on the key to copy it and use it for authentication in API.
Read the article for more details.
Customizing FastReport Online Designer
Now you can customize main colors and favicons used in the designer.
Designer with a different main color:
Colors and favicons can be customized in the “Theme” menu item when building FastReport Online Designer.
Those who own special OEM White Label FastReport Online Designer licenses can also change a product name and edit the boot screen text.
Added the ability to change components sizes independently from the grid
With pressed ALT, a component size can be changed independently from the grid, which allows you to adjust the size as precisely as possible.
Added the “Layout” function for positioning components
With this update, we added the Layout function for positioning components relative to each other and the grid.
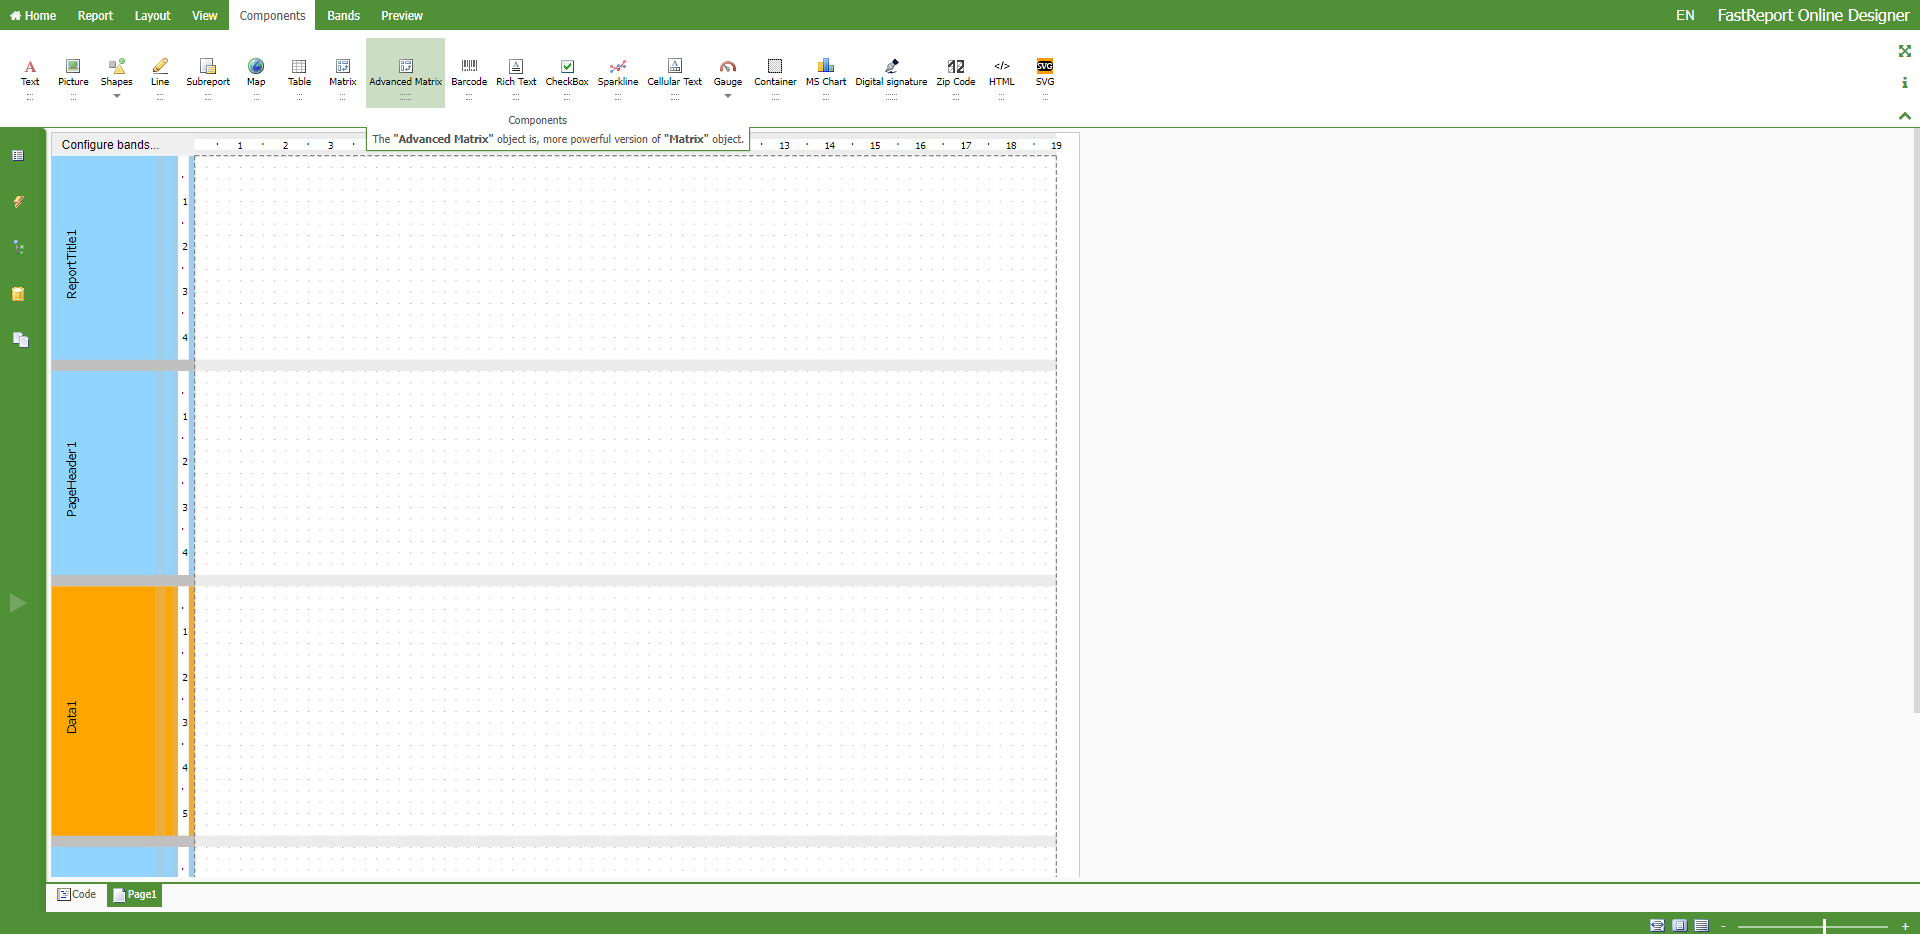
Added a modal window to configure bands
You can now change order of bands, add or delete them using a special modal window.
To open this window, click the button in the upper left corner of the workspace.
Added a new button to change localization in the upper panel of the Online Designer
You can now easily change localization no matter what panel is active at the moment.
Added the ability to expand the report from left to right and from top to bottom
You can expand the report from left to right and from top to bottom by clicking the buttons.
Improved design
In this version, we have changed most dialog windows to improve user experience when using the Online Designer.
Full list of changes
+ added the “MSChart” object;
+ added the “RichText” object;
+ added building the designer using the API;
+ added customization of the designer interface;
+ added configuration of icons;
+ added the “Layout” function for positioning components in the workspace;
+ added a modal window to configure bands;
+ added a new button to change localization in the upper panel of the Online Designer;
+ added the ability to expand the report from left to right and from top to bottom;
+ added the “OutlineExpression” button to edit parameter expressions;
+ added the SVG image editor;
+ added changeable width and height of the report dialog window;
+ added the ability to delete the table data source;
- fixed the “SubReport” object;
- fixed behavior of the “TextObject” when rotating text;
- fixed a bug when the report is viewed in full screen mode;
- fixed pages preview for long templates;
- fixed standard behavior of “OK” and “Cancel” buttons in the report dialog window;
- fixed behavior of groups of components—now popup panels close when focus is lost;
- fixed the way the table tree is displayed when establishing a connection in Firefox;
- fixed a bug when users see the preview tab even if the designer was built without it;
* improved design of all modal windows;
* improved the designer performance in Firefox;
* improved the style of Zoom control;
* updated localization of the product interface.


