There have been many innovations in FastReport VCL 5 recently. One of them is new hyperlink options. Now a hyperlink can point on the other report or a report page. Due to this option, we can make interactive reports. An example of such a report with hyperlinks detailing the report is shown in the article "How to make an interactive chart in FastReport VCL5». This time we will consider another option - a hyperlink to the detailing page.
Here we go!
Create a simple report with a list of customers.
1) On the Data tab, add the ADO database component. By double-clicking on the added object, open the connection editor. We configure the connection to the demo.mdb database from the delivery.
Data Provider - Microsoft Jet OLEDB 4.0 Provider. The database file is located in the folder C: \ Program Files (x86) \ FastReport 5 VCL Enterprise \ Demos \ Main \ demo.mdb.
Now place the ADO Query component. In its SQL property, enter the query:
1 2 3 4 5 |
SELECT * FROM customer a, orders b, items c, parts d WHERE a.custno = b.custno AND b.orderno = c.orderno AND c.partno = d.partno ORDER BY a.company, b.orderno |
2) Go to Page1 (a report page). In addition to already existing bands Report Title and MasterData, we need a GroupHeader. Add it. In this case you will be asked to configure the grouping. Select the CustNo field:
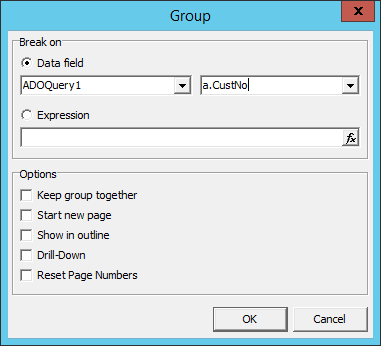
From the data source, drag the following fields to the "Group header" band:
Company, Phone, Fax.
Below we have the MasterData band. Double click on it and select an available data source:
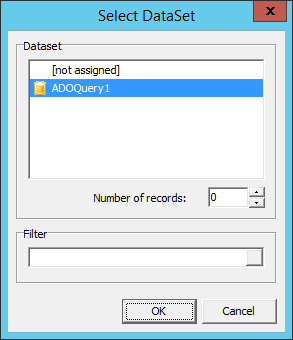
We will not display data in this band. We use it only for a data source for grouping. We set the band's Visible property to false.
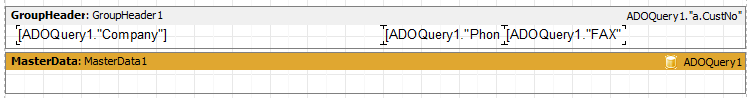
Here you are what happens next:
3) Now start creating a detail page, where we will display detailed information for the group, selected on the first page. For this, add one more page to the report, using the icon ![]() in the top toolbar. The page is empty. Add the following bands to it: GroupHeader, one more GroupHeader, MasterData, GroupFooter.
in the top toolbar. The page is empty. Add the following bands to it: GroupHeader, one more GroupHeader, MasterData, GroupFooter.
For the first group header, select the grouping field - CustNo.

For the second one – OrderNo.

For the MasterData band, select an available data source.
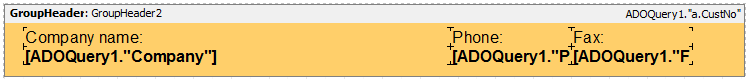
We will place the following fields: Company, Phone and Fax on the first band GroupHeader . As you might have noticed, this grouping matches with the grouping on the first page of the report.
Now change the background color and add the titles.
On the second band "GroupHeader" we place the fields: OrderNo and SaleDate.
In the same band, display the headings for the fields in the MasterData band: Part, Description, Price, Qty, Total.

Finally, we place the fields on the MasterData band: PartNo, Description, ListPrice, Qty. And for Total, we add the following expression:
[<ADOQuery1. "Qty"> * <ADOQuery1. "ListPrice">]
Now the MasterData band looks like this:
![]()
In the GroupFooter band add a text field and enter the following expression:
Total: [Sum (<ADOQuery1. "Qty"> * <ADOQuery1. "List Price">)]
As you understand, this is the sum of all results. The overall result is:
![]()
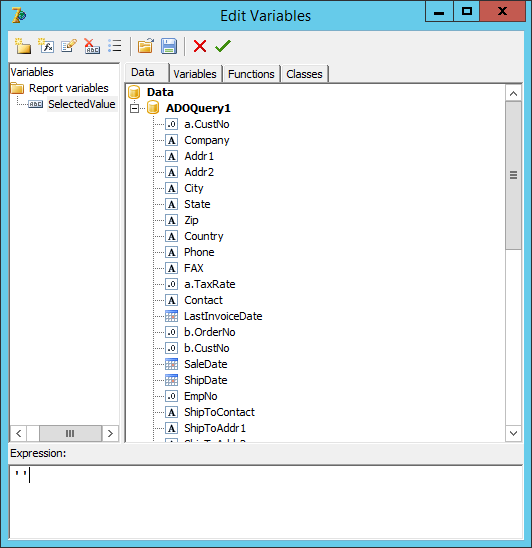
4) You need to create the SelectedValue variable in the report. We will save the name of the selected company on the first page in it. Then we will filter the data on the second page:
5) Double-click the MasterData band. In the Filter field, enter the expression:
<ADOQuery1. "Company"> = <SelectedValue>
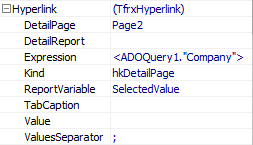
6) Let us move to the first page. We need the Company field in the MasterData band. Select it. In the Property inspector, find a Hyperlink and expand it. Since a detailed report is on the second page, in the DetailPage property, we write Page2. In the Expression property, we specify an expression to be passed to the report variable. Next, we set the type of the hyperlink in the Kind property. The value of hkDetailPage. Then, we enter the name of the SelectedValue report variable in the ReportVariable property.
Now run the report:
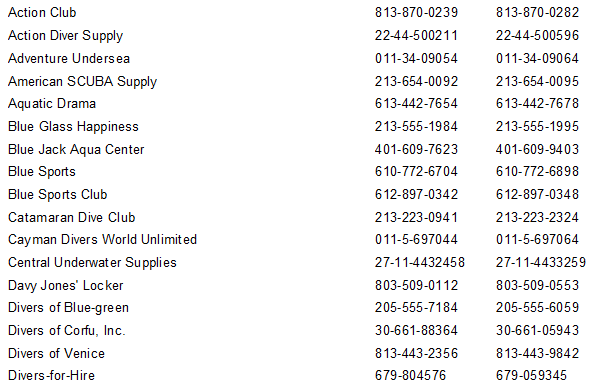
Choose a name of a company:
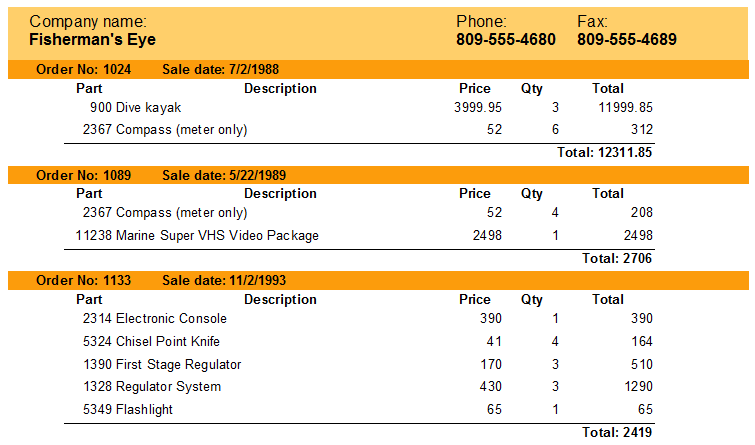
This way we get a detailed report.
Now we can conclude, that instead of the second page in your report, you can use a separate report. But if you do not like individual files and think, that a report should be self-sufficient, then an option with detailing page is for you.
