Using the chart editor, you can set up appearance of each chart element. All properties (more than 100) are splitted in several categories. Some of them are specific to "Chart" object, while others are part of series.
If you choose the "Chart" object from the series list, you will see the following property pages:
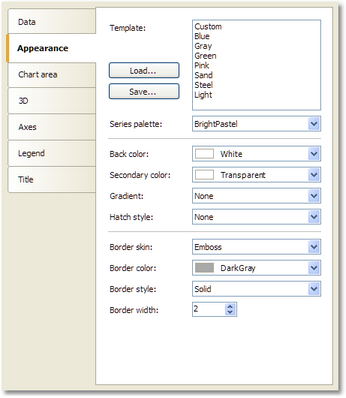
| • | "Appearance" - border and fill of the chart; |
| • | "Chart area" - border, fill, shadow; |
| • | "3D" - 3D settings; |
| • | "Axes" - setup appearance of axis, its title, labels, grid, markers, custom labels and strips; |
| • | "Legend" - style of legend, docking, border, fill, shadow and font; |
| • | "Title" - style of title, docking, border, fill, shadow, font. |
If you choose the series object from the series list, you will see the following property pages:
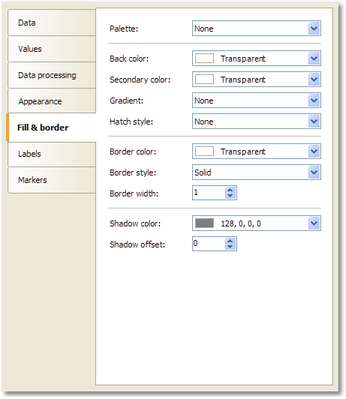
| • | "Appearance" - some settings specific to the selected series type; |
| • | "Fill & border" - fill and border of the series values; |
| • | "Labels" - series labels. You can choose label type, font, color and fill; |
| • | "Markers" - series markers. You can choose marker type, its color and border. |