You can set conditional highlighting for matrix cells, just like for "Text" object. More details about this can be found in the "Conditional highlighting" section.
Let us look at Example 2, and see how to highlight an amount more than 3000 in red. For this, select the cell with "Revenue" text and press the ![]() button on "Text" toolbar. In the conditions editor, add the following condition:
button on "Text" toolbar. In the conditions editor, add the following condition:
Value > 3000
Choose red text color for the condition. A prepared report will be as follows:
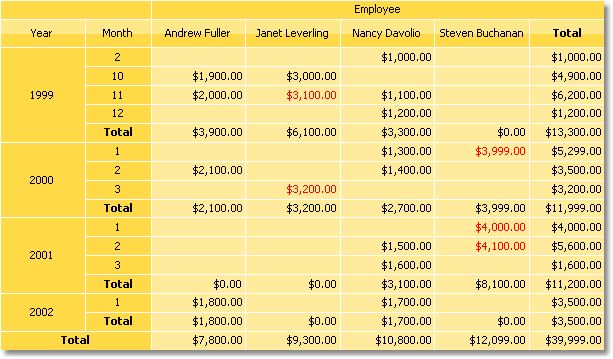
As seen, total values are not highlighted. This occurred, because we chose highlight condition for only one cell. To highlight the rest of the values, it is needed to set up the highlight for all matrix cells.
In this example we used conditional highlight which depends on cell value itself. Besides, you can highlight a cell depending on values from matrix headers. We will show by the following example, how to highlight cells, which are belongs to 2000 year, in red. For this, select matrix cells as shown in the figure below:
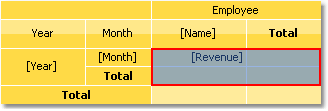
Set the following highlight condition:
(int)Matrix1.RowValues[0] == 2000
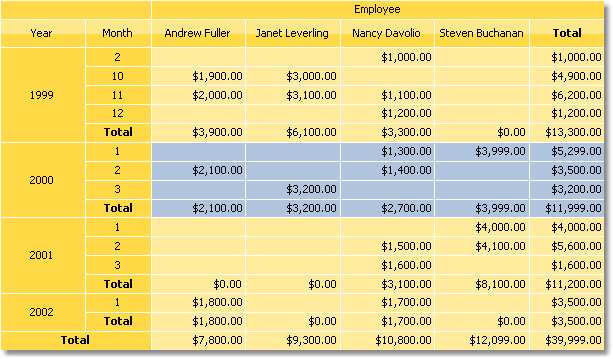
In this case "Matrix1" is a name of our matrix. The "RowValues" property of the matrix has got an "object[]" type and contains an array of values from the row header of the current printed row. Number of values in array is equal to number of levels in a header. There are two values in our example, the first one is "Year" and the second one is "Month".
Do not highlight the last row. "RowValues" property has an undetermined value for it and will cause an error when building the report.
When we run the report, we will have the following result:
You can also use matrix's "ColumnValues" property for column values reference.