Report outline (also known as the "document map") is a TreeView control displayed in the preview window:
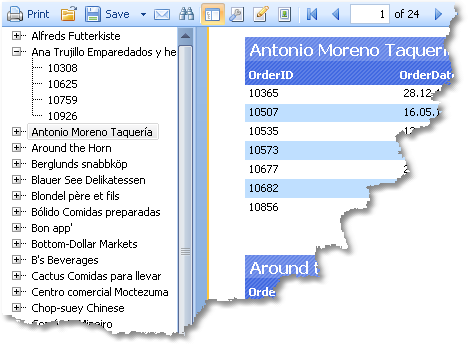
This control shows a tree structure, which was formed during the report building. If you click the tree element, you will navigate to the corresponding report element.
If the report has got an outline, it will be shown automatically. You can show or hide the outline by clicking the ![]() button on the toolbar. The report does not create an outline automatically - you should take care about this.
button on the toolbar. The report does not create an outline automatically - you should take care about this.
The report page and all its bands have the "OutlineExpression" property. To fill the outline, indicate an expression which returns the element's text in this property. This expression will be calculated when printing a band, and its value will be added to the outline. If your report is of master-detail or group type, the structure of the outline will be similar to the report's structure.
The "OutlineExpression" property can be set in the "Properties" window.
Here are the recommendations on how to configure the outline for different types of reports:
| • | if you want to show the sheets of a prepared report in the outline, set the "OutlineExpression" property of the report page. The expression will return the number of the page: |
[PageN]
| • | in the "Simple list" report type with one "Data" band, set the "OutlineExpression" property of that band. As an expression, use any data column which is printed in the band; |
| • | in the master-detail report type with two "Data" bands, set the "OutlineExpression" property of the corresponding bands. For example, in the "Category/Product" report type, the "OutlineExpression" for the first band will contain the name of the category, for the second - product's name; |
| • | in the group report, configure the "OutlineExpression" property of the group header and a "Data" band. As an expression for the group header, use the grouping condition. For the "Data" band, use any data column which is printed in the band. |