In this example we will see how to build a detailed report if we click on the cell of the "Matrix" object. As an example, we will use a matrix which displays the sales of employees grouped by year.
As a data source for the matrix, the "MatrixDemo" table is used. It presents the sales of the employees, grouped by year and month:
Name |
Year |
Month |
ItemsSold |
Revenue |
Nancy Davolio |
1999 |
2 |
1 |
1000 |
Nancy Davolio |
1999 |
11 |
1 |
1100 |
Nancy Davolio |
1999 |
12 |
1 |
1200 |
Nancy Davolio |
2000 |
1 |
1 |
1300 |
Nancy Davolio |
2000 |
2 |
2 |
1400 |
Nancy Davolio |
2001 |
2 |
2 |
1500 |
Nancy Davolio |
2001 |
3 |
2 |
1600 |
Nancy Davolio |
2002 |
1 |
2 |
1700 |
Andrew Fuller |
2002 |
1 |
2 |
1800 |
Andrew Fuller |
1999 |
10 |
2 |
1900 |
Andrew Fuller |
1999 |
11 |
2 |
2000 |
Andrew Fuller |
2000 |
2 |
2 |
2100 |
Janet Leverling |
1999 |
10 |
3 |
3000 |
Janet Leverling |
1999 |
11 |
3 |
3100 |
Janet Leverling |
2000 |
3 |
3 |
3200 |
Steven Buchanan |
2001 |
1 |
3 |
4000 |
Steven Buchanan |
2001 |
2 |
4 |
4100 |
Steven Buchanan |
2000 |
1 |
4 |
3999 |
Configure the matrix in the following way:
| • | put the "MatrixDemo.Year" data column in the column header; |
| • | put the "MatrixDemo.Name" data column in the row header; |
| • | put the "MatrixDemo.Revenue" data column in the cell. |
A prepared matrix will be as follows:
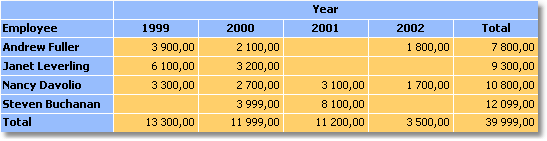
As seen, the value of a cell is the sum of employee's sales for the whole year. Let us create a detailed report which will be displayed when we click the cell. In our case the detailed report can contain the sales of a selected employee for every month of a selected year.
How to connect a cell with data, on which basis it was printed? Each cell of the matrix has got its own address. This is a combination of the values from the column and row headers. In our example, the address of the cell is a combination of the year and name of the employee. Exactly this data can be passed to the detailed report. How can this be done? Very simple: set the hyperlink, showing only the report name and name of the parameter. Parameter values do not need to be indicated: for a matrix cell, FastReport itself forms the value and passes it into the parameter.
Assuming that, we have clicked on the top left cell, containing the number 3900. This is the sum of the sales of the employee named "Andrew Fuller" for the year 1999. What form is used to pass this value into the parameter? FastReport combines column and row values, by using a separator:
1999;Andrew Fuller
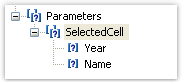
Does it mean that we must extract the value of the year and the name of the employee from this string, convert the year into the int, and use these values for data filtering? No, it's much simpler. All that we need to do is to create a parameter that has nested parameters. You can learn about this in the "Data" chapter. In the given case, parent parameter can be like this:
When creating the parameter, consider the following moments:
| • | you don't need to set up the parent parameter. Just give it the name; |
| • | a parent parameter must have as many nested parameters, as there are values passed from the matrix. In the given case, there are two values; |
| • | order of the nested parameters must correspond with the order of the values passed from the matrix. In our case, the year will be passed in the first parameter, and the employee name will be passed in the second parameter; |
| • | nested parameters can be named as you wish, but it is better to give them names which correspond with the names of the matrix elements; |
| • | it is very important to set the data type for every nested parameter correctly. Data type must correspond with the value, which is passed into the parameter. In our case, the first parameter (Year) must be an integer type, and the second (employee name) - String. |
After we have clarified all the needed things, we will create the report. Select the cell of the matrix and call the hyperlink editor:
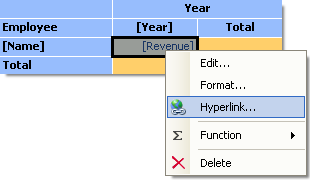
In the hyperlink configuration, indicate the parent parameter as a report parameter (in our example - "SelectedCell"):
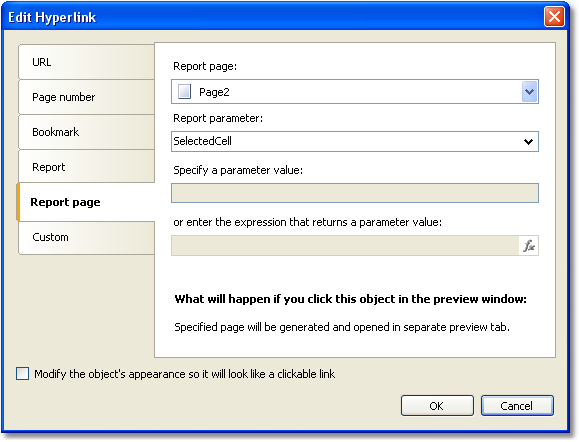
FastReport passes the values into the SelectedCell.Year and SelectedCell.Name nested parameters. These values will be converted into data types, indicated in the parameter configuration - this is why it is important to configure parameter data types correctly.
Detailed report is placed on a separate page of the main report and uses the same data source:
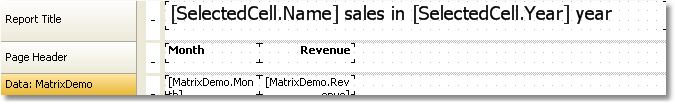
In order to show the sales of a chosen employee for a chosen year, set up the filtering. For this, open the "Data" band editor and indicate the following filtering condition:
[MatrixDemo.Year] == [SelectedCell.Year] && [MatrixDemo.Name] == [SelectedCell.Name]
The report is ready. Run it for execution and click on the top left cell. A detailed report will be opened, having the following data:
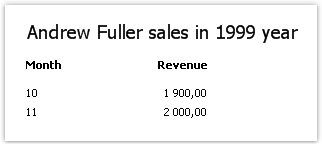
As seen, the sum of the values (1900+2000) corresponds with the cell of the matrix, on which we clicked.