In the previous example we created a chart using data from a DB table. A chart can also be created from manually entered data. This method can be convenient if the chart is small.
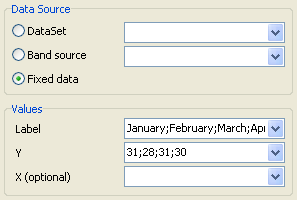
Let's demonstrate how this works with a simple example. Place a chart on the report design page and open the chart editor. Add a series of “Bar chart” type and set these properties, using semi-colons to separate individual values:
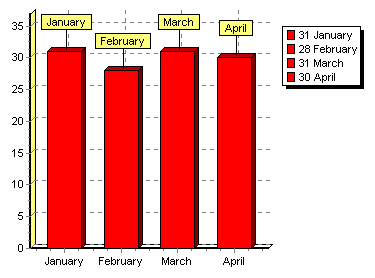
The resulting chart is: