A band in the designer appears in form of a rectangular area. A band, like many other report objects, can have a border and fill (by default they are disabled). Apart from this, a band displays a grid. To set the grid mode, go the "View|Options..." menu and choose "Report page". Grid can also be enabled or disabled in the "View" menu.
You can set the band's height in three ways:
| • | place the mouse pointer at the bottom of the band. The cursor shape will be changed to "horizontal splitter" and you can resize a band. |
| • | drag the band handle on the left ruler. |
| • | use "Properties" window to set the band's Height property. |
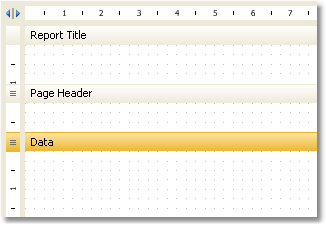
The designer has two modes of displaying bands, between which you can switch at any time. In the first mode, every band has got a header, which contains the title of the band and useful information about it (for example, the name of the data source to which it is connected).
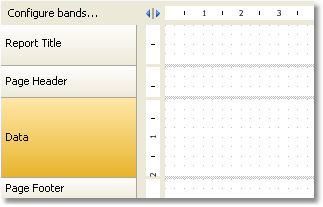
In the second mode, the band does not have a header. Instead of that, on the left side of the window, the structure of the bands is displayed. This mode helps to easily understand the structure of the report, especially if it was not created by you.
You can switch between these modes by clicking the ![]() button.
button.