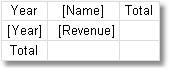
The matrix will contain one value in a row and a column as well as one data cell. In order to build a matrix you need to add "MatrixDemo" data columns in the following way:
| • | add "Year" data column to the row header; |
| • | add "Name" data column to the column header; |
| • | add "Revenue" data column to the matrix cell. |
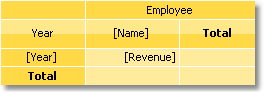
After that the matrix will look as follows:
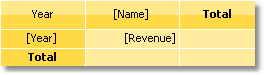
Let us improve the matrix appearance:
| • | choose "Orange" style for the matrix; |
| • | choose "Tahoma, 8" font for all matrix cells; |
| • | select the word "Total" with bold type; |
| • | choose "Glass" type filling for the cells in upper row; |
| • | disable the autosize of the matrix and increase the size of rows and columns. |
After that the matrix will have the following view:
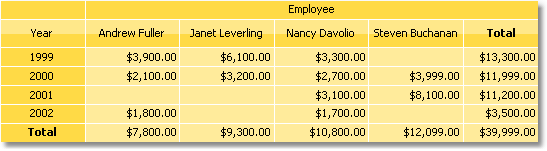
Run the report and you will see the following result:
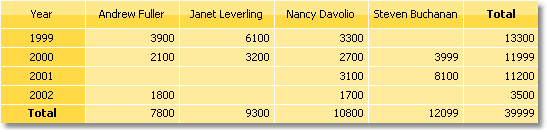
There is lack of the following things in the matrix:
| • | there is no title for the "Name" data column; |
| • | sums are not printed in currency format; |
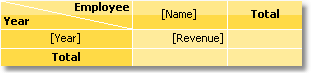
You can add a title for "Name" data column in the following way:
| • | the text "Year/Employee" can be put into the left upper corner of the matrix; |
| • | diagonal line and the second "Text" object can be placed there, as shown below: |
| • | enable the matrix title. To do this, choose the "Show Title" item in the context menu of the "Matrix" object. Any text can be included in the title: |
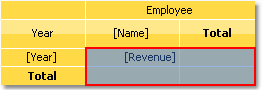
In order to set the data formatting, select the whole cell area, as shown in the figure below, and set format by selecting the "Format..." item in the context menu:
After that, a prepared report will be as follows: