The chart, as well as other report objects, can be interactive. You can set up chart in the way, that when you click its value, another (detailed) report will be executed and shown. To do this, you need to set up the "Hyperlink" property as described in the "Interactive reports" chapter. The chart will pass the value to a hyperlink by itself, when you click on its element.
Let us observe the "Charts/Interactive Chart" report from the FastReport demo program.
Create a report with two pages. The first page will contain a chart, the second one will contain a detailed report that will be displayed when you click a chart value.
Place the "Chart" object on the first report page and set up its properties in the chart editor:
| • | select the "Chart" element from the series list and choose the MatrixDemo data source; |
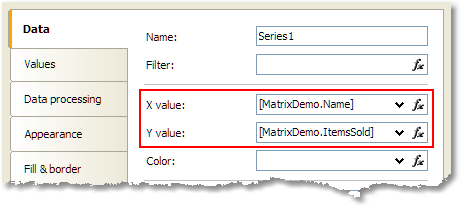
| • | select the series from the series list and set up X and Y values: X = [MatrixDemo.Name], Y = [MatrixDemo.ItemsSold]: |
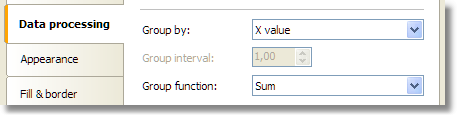
| • | switch to the "Data processing" tab and select the group type - "X value": |
On the second report page, create the list-type report:
| • | in the "Data" window, create a new report parameter called "SelectedEmployee"; |
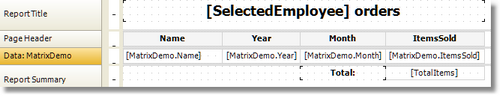
| • | create the following report layout: |
| • | open the data band editor and indicate the following filter condition: |
[MatrixDemo.Name] == [SelectedEmployee]
Now set up the hyperlink of the "Chart" object:
| • | in the context menu of the "Chart" object, select "Hyperlink..."; |
| • | choose the hyperlink type - "Report page"; |
| • | choose the second report page and indicate the parameter name - SelectedEmployee. |
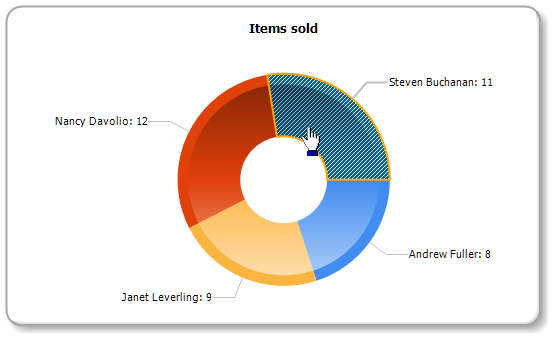
The report is finished. Run it and move the mouse to any chart value. This value will be visually selected, and the mouse cursor will change its shape:
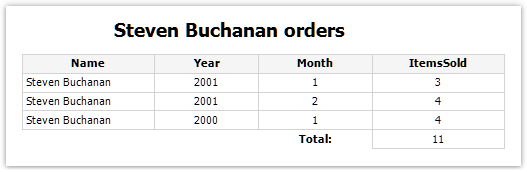
If you click the value, you will see the following detailed report: