This instrument for data processing allows to collect several series value into one value. You can choose one of the following algorithms:
Algorithm |
Description |
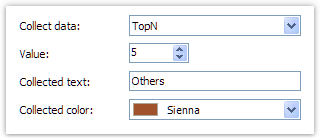
TopN |
Only top N values are displayed. All other values are collected and displayed as "others" value (you can choose the label for this value). |
BottomN |
Bottom N values are displayed. If the text for the collected value is not set, this value is not displayed. |
Less than value |
Series values less than specified value, are collected and displayed as "others" value. |
Less than percent |
Series values less than specified percent, are collected and displayed as "others" value. |
Greater than value |
Series values greater than specified value, are collected and displayed as "others" value. |
Greater than percent |
Series values greater than specified percent, are collected and displayed as "others" value. |
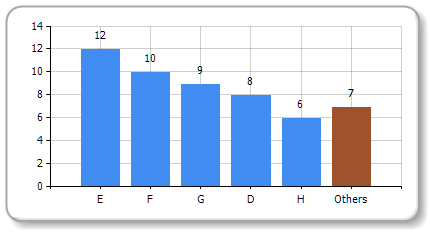
For example, to display top 5 values, set up the series in the following way:
You will get the following result: